
Understanding Technical Analysis
-
by bytethebuzz
- 2248
Technical analysis is a tool that investors use to evaluate investments and identify trading opportunities. Using charts and numerical analysis, technical analysts seek to predict future price movements of a security, commodity, or currency.
Technical analysis is often used in conjunction with fundamental analysis, which focuses on factors such as a company’s financial statements, political conditions, and economic indicators. Many investors believe that the two approaches are complementary and use both to make informed investment decisions. Technical analysis is based on the premise that markets have assigned correct prices to securities and that price movement is not random. Technical analysts believe that prices move in trends and that these trends can be identified and used to make profitable trading decisions.
There are two main approaches to technical analysis:
- 1. Fundamental analysis
- 2. Charting
1. Fundamental analysis
Fundamental analysis is a method of valuation that uses financial statement analysis to quantify a security’s intrinsic value. Fundamental analysts believe that a security’s price will eventually move towards its intrinsic value. They use a variety of techniques to identify under-valued and over-valued securities.
2. Charting
Charting is a graphical approach to analyzing security prices. It typically involves the use of charts to track price movements over time. Technical analysts believe that price patterns can be used to predict future price movements.
There are two main types of charts that technical analysts use:
- Bar charts
- Candlestick charts
1. Bar charts
Bar charts are the most common type of chart used by technical analysts. They show the open, high, low, and close price for a security for a given period of time. Bar charts can be used to identify price patterns such as trends, reversals, and breakouts.
2. Candlestick charts
Candlestick charts are another type of chart that technical analysts use. They show the same information as bar charts, but they also provide information on the [open, high, low, and close prices. Candlestick charts can be used to identify [price patterns]such as trends, reversals, and breakouts. Now in this article we will discuss various kind of chart patterns one by one.
Types of Chart Patterns
The wedge pattern
The wedge pattern is a continuation pattern that is typically seen as a bullish signal. It is formed when the price action creates a narrowing pattern, with the highs and lows converging towards each other. This can be either in an uptrend or a downtrend.
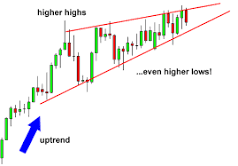
There are three types of wedge patterns:
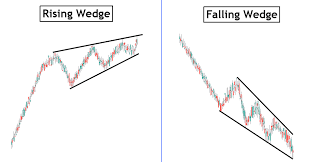
- Rising wedge
- Falling wedge
- Bullish or bearish flag
Rising wedge
The rising wedge is a bearish pattern that is typically seen as a sign that the current uptrend is coming to an end. It is formed when the price action creates a series of higher highs and higher lows, with the highs and lows converging towards each other.
Falling wedge
The falling wedge is a bullish pattern that is typically seen as a sign that the current downtrend is coming to an end. It is formed when the price action creates a series of lower lows and lower highs, with the highs and lows converging towards each other.
Bullish or bearish flag
The bullish or bearish flag is a continuation pattern that is formed when the price action creates a flag-like shape. This shape is created by a series of lower highs and higher lows, with the highs and lows converging towards each other.
Bullish Candlestick Chart Patterns
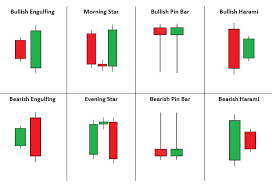
Candlestick chart patterns can be used to predict future price movements in the markets. There are many different kinds of candlestick patterns, but here we will focus on the bullish patterns that indicate a potential price increase.
- The Bullish Engulfing
- The Morning Star Pattern
- The Three Black Crows Pattern
The Bullish Engulfing Pattern occurs when a small black candlestick is followed by a large white candlestick. This pattern indicates that the bears are losing control and the bulls are taking over. The engulfing candle should completely “engulf” the previous candle, meaning that its body should be larger in both height and width.
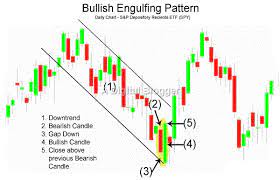
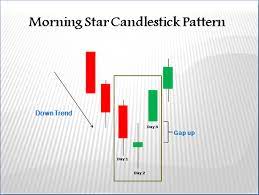
The Morning Star Pattern is a three-candlestick pattern that indicates a reversal from bearish to bullish. It is composed of a large black candle, a small white candle in the middle, and a large white candle at the end. This pattern shows that the bears are losing strength and the bulls are taking control.
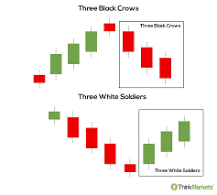
The Three Black Crows Pattern is the opposite of the Morning Star Pattern. It is a three-candlestick pattern that indicates a reversal from bullish to bearish. It is composed of a large white candle, a small black candle in the middle, and a large black candle at the end. This pattern shows that the bulls are losing strength and the bears are taking control.
You can learn more about chart patterns and technical analysis only on byte the buzz. Stay tuned with us for more upcoming knowledge on stock market technical analysis.
Technical analysis is a tool that investors use to evaluate investments and identify trading opportunities. Using charts and numerical analysis, technical analysts seek to predict future price movements of a security, commodity, or currency. Technical analysis is often used in conjunction with fundamental analysis, which focuses on factors such as…
Technical analysis is a tool that investors use to evaluate investments and identify trading opportunities. Using charts and numerical analysis, technical analysts seek to predict future price movements of a security, commodity, or currency. Technical analysis is often used in conjunction with fundamental analysis, which focuses on factors such as…